A Young and Volatile Growth Stock

Key Technical Observations:
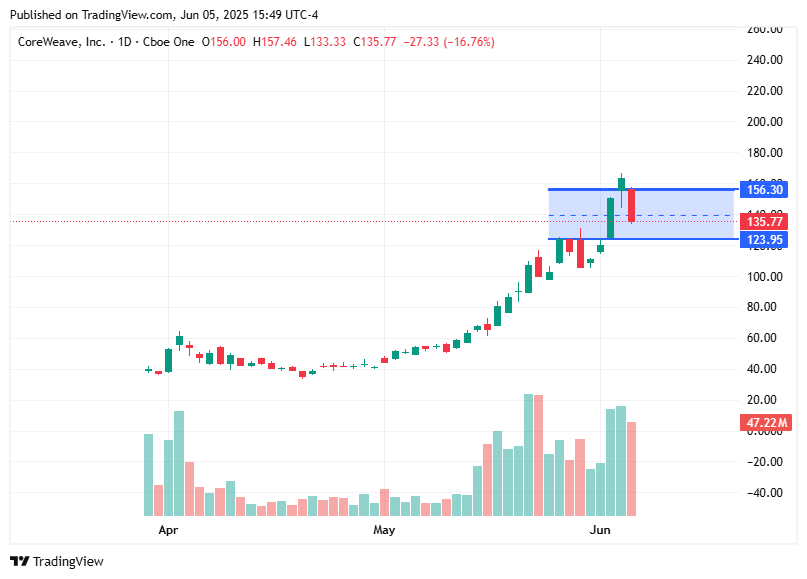
Parabolic Run-up: The stock experienced a massive uptrend from April through early June, climbing from below $40 to a peak near $180—this is a classic parabolic advance, often followed by sharp corrections.
Bearish Engulfing & Heavy Volume: On June 5, the candlestick shows a large red candle with a close at $135.77 (-16.76%), engulfing the previous day’s range—this is a bearish reversal signal, especially with very high volume (47.22M) indicating institutional selling.
Support and Resistance Zone:
Support: Around $123.95 (lower blue line).
Resistance: Near $156.30 (upper blue line).
The current price is testing the mid-range ($135.77), suggesting a potential consolidation zone.
Volume Profile: Strong volume surges started in mid-May and peaked at the top—suggesting distribution, not just accumulation.
The stock is likely entering a cooling-off or consolidation phase. A break below $124 with volume could signal a deeper retracement. Watch for stabilization or base formation before considering new positions.
_
Footnotes:


