CRDO
Strong bull with room to run.
Credo Technology Group Holding Ltd is a provider of high-performance serial connectivity solutions for the hyperscale datacenter, 5G carrier, enterprise networking, artificial intelligence and high-performance computing markets. Credo Technology Group Holding Ltd is based in SAN JOSE, Calif.

Credo Technology Group Holding Ltd. (NASDAQ: CRDO) delivered a standout performance in its most recent quarter, reporting earnings per share (EPS) of $0.35—surpassing analyst estimates of $0.27 by more than 29%¹. The quarter’s revenue grew nearly 180% year-over-year, marking one of the strongest quarterly expansions in its sector¹.
Annual Earnings Growth
Credo’s trailing twelve-month revenue reached $436.8 million, with annual EPS at $0.29². These figures represent a significant jump from prior years. Analysts forecast a further surge in annual EPS—projecting a 354% gain, from $0.13 to $0.59 over the next year³.
New Products or Price Highs
Innovation continues to fuel Credo’s growth. The recent launch of its PILOT diagnostic software platform enhances its offerings for high-speed connectivity and AI data infrastructure⁵. The stock has also reached a 52-week high near $104, indicating strong investor enthusiasm and potential for a sustained breakout⁵.
Supply and Demand
CRDO maintains a float of approximately 149 million shares, with institutional ownership accounting for more than 75%⁴. Short interest sits at a moderate 6.7%, equal to about 10 million shares, and a days-to-cover ratio of roughly 2—indicating manageable selling pressure and continued institutional demand⁶.
Leader or Laggard
Year-to-date, Credo shares have surged over 230%, significantly outperforming broader tech indices⁷. The stock’s high beta (2.6) indicates heightened volatility but also reflects its strong momentum relative to industry peers. Analysts largely maintain bullish price targets between $86 and $95⁷.
Institutional Sponsorship
Credo’s investor base includes major institutions like Vanguard, BlackRock, and Point72. In total, approximately 835 institutions collectively hold 150 million shares, representing around 78% of the float⁴. This level of sponsorship reinforces confidence in the company’s long-term outlook.
Market Direction
Despite macroeconomic caution in the broader tech space, Credo benefits from structural tailwinds in AI and data-center infrastructure. While its elevated P/E ratio (~350) implies valuation risk, the overall sector remains supported by robust demand⁷.
Credo Technology Group demonstrates strength across the CAN SLIM model, with standout earnings, aggressive growth projections, innovation leadership, and significant institutional support. Its performance and positioning make it a compelling candidate for growth-oriented investors—albeit one suited to those comfortable with volatility and premium valuations.
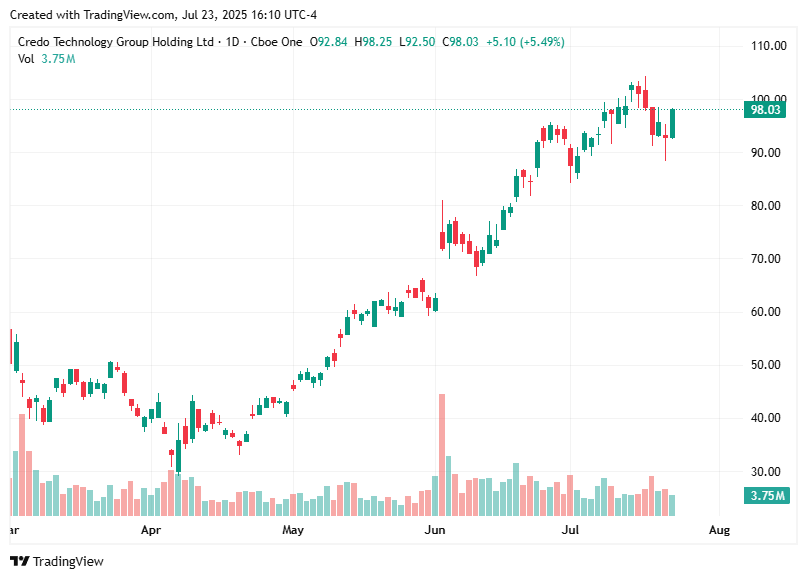
CRDO Technical Summary & Price Action Overview
CRDO's price action remains constructive with a well-supported uptrend, robust institutional participation, and a textbook breakout pattern. A mild retracement toward the $92–96 area would offer a healthier entry point for momentum traders seeking risk-managed exposure. The broader pattern and moving average alignment support further upside if volume confirms strength above the $100–102 resistance zone.
CRDO continues to display a strong technical chart setup, with price action confirming a bullish breakout and trend continuity:
Price Structure: CRDO recently completed a classic cup-with-handle base, breaking out above the $80.99 pivot level with strong volume. This breakout pushed the stock toward new all-time highs near $104, establishing a clear uptrend.
Trend Direction: The stock is firmly trading above all key moving averages—5-day, 50-day (
$97.43), and 200-day ($90.64)—demonstrating healthy institutional accumulation and sustained buying interest.Volume Pattern: Accumulation days outnumber distribution days in recent sessions, affirming bullish sentiment. Recent pullbacks have occurred on lower volume, suggesting consolidation rather than a trend reversal.
Support & Resistance: Key support zones lie in the $89–96 range, aligned with the 50-day and 100-day moving averages. Immediate resistance is forming near $99–102, with a potential next target near $110 if momentum continues.
Momentum Indicators: The RSI remains neutral-bullish (~56), while the stochastic oscillator (>85) shows short-term overbought conditions—indicating a possible brief pause or pullback before the next leg up.
Chicago-style Footnotes
“Credo…reported $0.35 EPS for the quarter, topping consensus by $0.08; revenue was up 179.6% YoY,” MarketBeat, accessed July 23, 2025, https://www.marketbeat.com/stocks/NASDAQ/CRDO/earnings/.
“Revenue $436.78 M; Net Income $52.18 M; EPS $0.29,” StockAnalysis.com, accessed July 23, 2025, https://www.stockanalysis.com/stocks/crdo/.
“Earnings for Credo…expected to grow by 353.85%…from $0.13 to $0.59,” MarketBeat, accessed July 23, 2025, https://www.marketbeat.com/stocks/NASDAQ/CRDO/earnings/.
“Institutional Owners: 835; institutions hold ~150.7 M shares,” Fintel, accessed July 23, 2025, https://fintel.io/so/us/crdo.
“Credo launches PILOT…; stock hit a record high amid AI data center ramps,” Market Chameleon and Business Wire, accessed July 23, 2025, https://www.businesswire.com/news/home/20240719005392/en/.
“Short interest of 10 M shares, representing 6.69% of float; days-to-cover ~2,” MarketBeat, accessed July 23, 2025, https://www.marketbeat.com/stocks/NASDAQ/CRDO/short-interest/.
“52‑week price change +230.76%; Beta 2.58; Inst Own ~74.6%; P/E ~350,” Finviz and StockAnalysis.com, accessed July 23, 2025, https://finviz.com/quote.ashx?t=crdo.


